All acquisitions were made between 2019 and 2021 with different sensors and in two different laboratories (Polish, Italian).
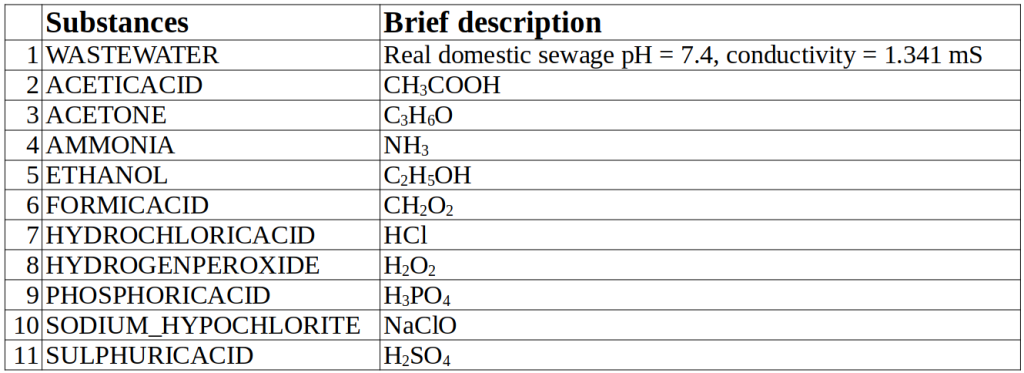
The dataset contains measures obtained on 10 substances plus the background (the wastewater – WW):
The measurement protocol has been divided into two steps:
- 600 samples are acquired in warm-up mode, in this period of time sensors are exposed to WW only;
- 1000 samples are acquired after analyte injection.
In this way, each acquisition contains 1,600 samples where the first 600 samples are measured in WW and the remaining 1000 samples are measured with the analyte mixed to WW. We can observe that obviously in the case of the 10 acquisitions of WW no substance has been injected during the entire acquisition (1600 samples).
The acquisition of each sample requires 1.6 seconds and consequently, each cycle is about 40 minutes long.
The dataset consists of 10 data acquisitions for each of the 11 substances (13 pollutants plus WW) carried out with the measurement protocol previously described.
In the following figure is reported an example of the signals measured for different substances (ACETONE, HYDROCHLORICACID – HCL, etc.), for different frequencies (200Hz, 78kHz) in the case of PLATINUM IDE.
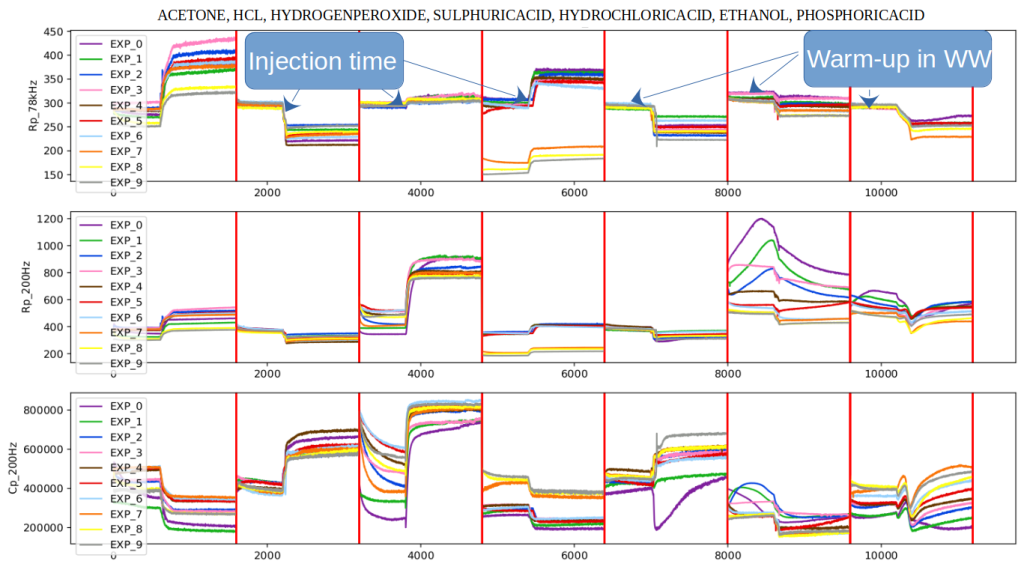
The step in the middle of each acquisition corresponds to the injection of the substance. Let’s make some observations about the temporal trend of the measurements:
-
often, the value of the baseline (the starting point of the curve) changes between different acquisitions: this phenomenon is partially related to poisoning, aging, and to the differences in sensors;
-
the shape of the curves after the injection time could be very different among different experiments;
-
the curve should not be interpreted as a “time series”, because the slope after the injection and in general its shape, is strongly related to the speed of the injection of the substance that in the real scenario could have huge variability.
Training and test set
For each substance, 9 acquisitions have been added to the training set and 1 has been added to the test set. The following table report the number of samples for each substance in the training and the test set:
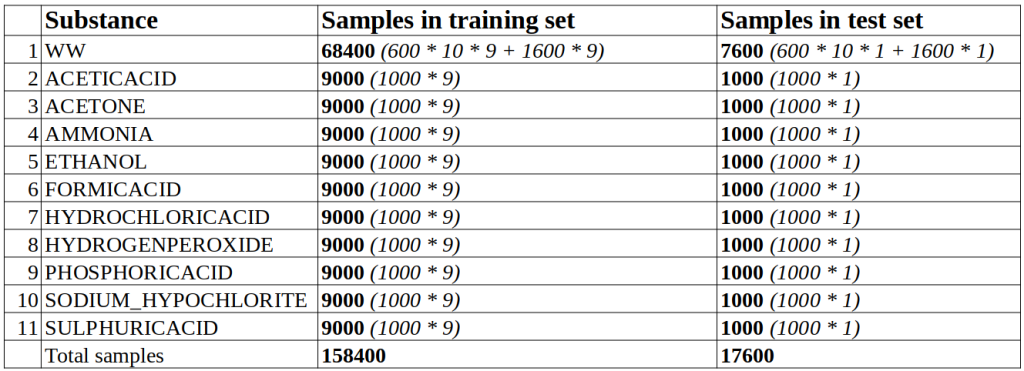
In particular, for wastewater, in the training set there are:
-
-
600 samples coming from warm-up for each of the 10 substances and for each of the 9 acquisitions;
-
1600 samples coming from 9 acquisitions made only in wastewater
-
while in the test set there are:
-
600 samples coming from warm-up for each of the 10 substances and from 1 acquisition.
-
1600 samples coming from 1 acquisition made only in wastewater.
Data structure
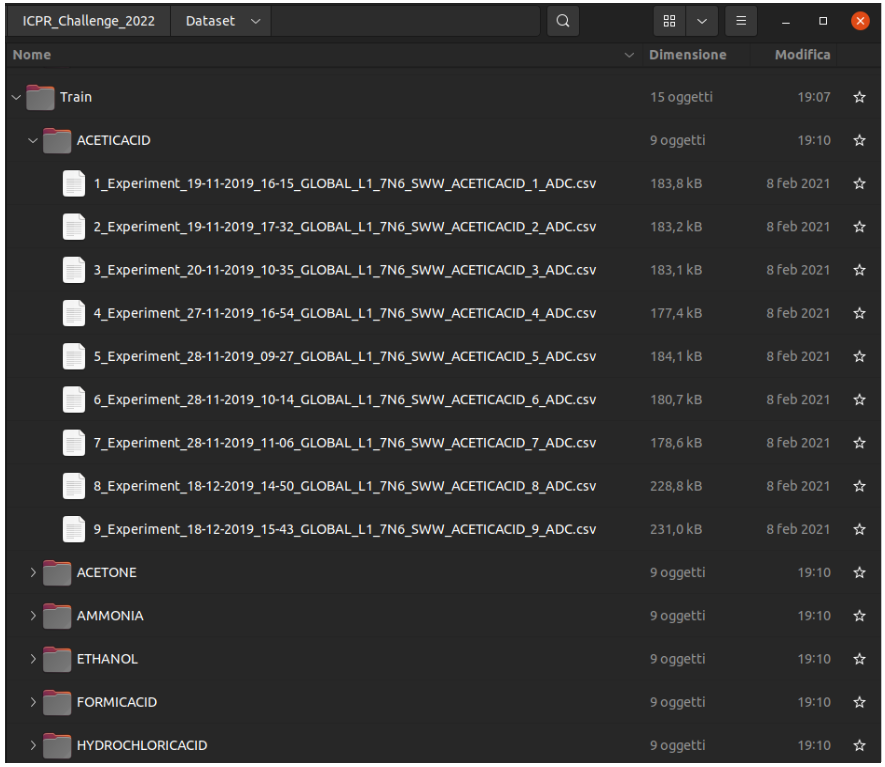
Each acquisition is contained in a .csv file where the name contains:
1_Experiment_19-11-2019_16-15_GLOBAL_L1_7N6_SWW_ACETICACID_1_ADC.csv
-
The number of the experiment: 1_Experiment
-
Date and hour of the acquisition: 19-11-2019_16-15
-
Id of the adopted sensor: L1_7N6
-
Substance: ACETICACID (this name will not be present in the test set!)
-
Data type: ADC => integer values (Analog to Digital Converter values)
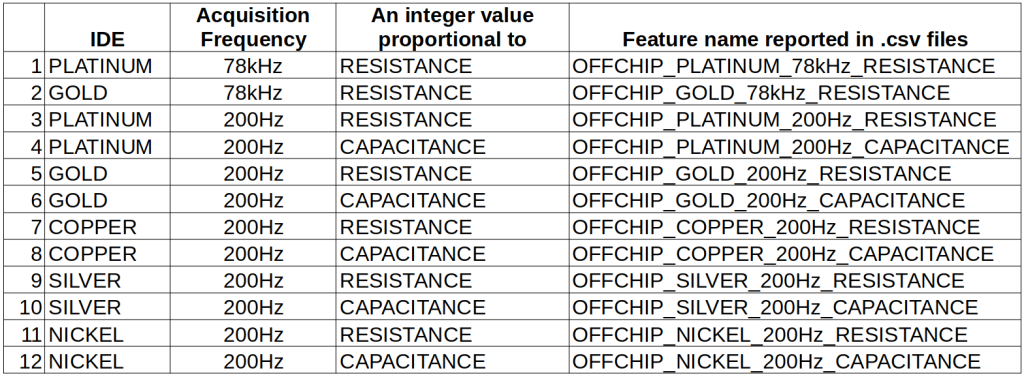
and the data column follows the structure reported in the following table:
The training data are contained in a folder that contains a sub-folder for each substance. The folder of a single substance contains 9 files, one for each acquisition.
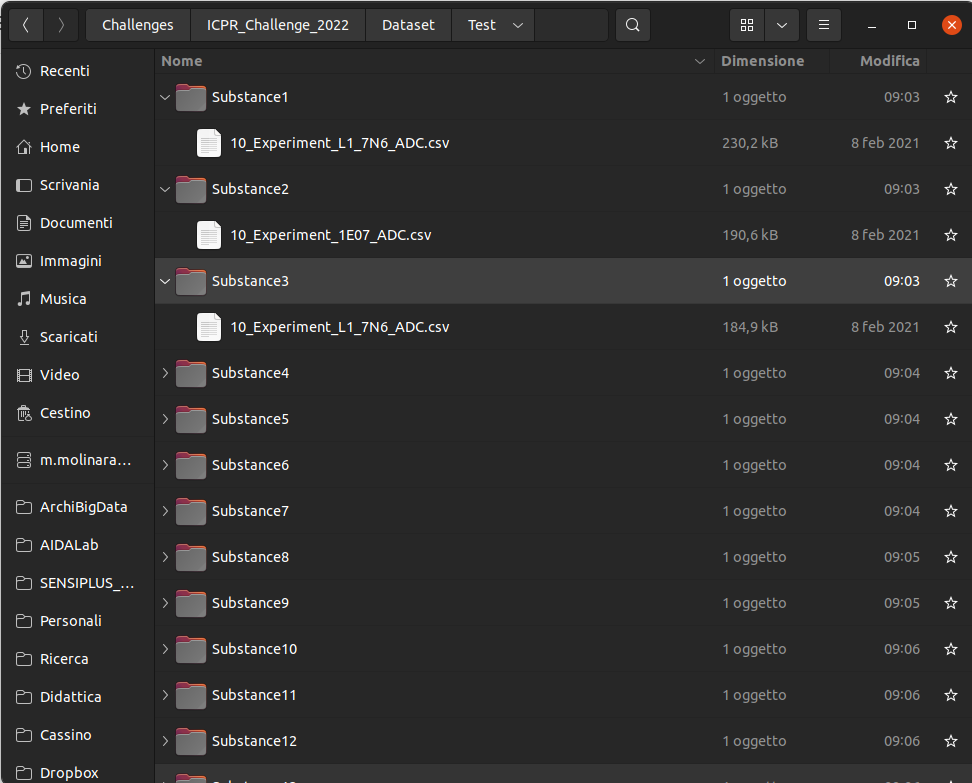
The test data (that will be hidden from the challengers) are contained into a folder that contains a sub-folder for each substance. The folder of a single substance contains 1 file (a single acquisition).
Example of a csv file for training
This is an example of CSV file for training:
Each row represents a sample containing a value for all the features (as reported in Table 2). Each column represents the trend over time of the single feature. Please remember the first 600 rows are measured in wastewater, while the remaining 1000 samples are measured in the current substance (ACEDICACID in this example, as reported in the filename). The total number of rows for each file is equal to 1600 and the substance has been injected at the timestamp 600.
Example of a CSV file for test
This is an example of a CSV file for training. In this case, the file contains only the features while there isn’t any information that gives some hints on the measured substance.
Downloads of the entire training set
Downloads of the entire test set
Evaluation metrics
For the detection task, the Matthews Correlation Coefficient MCC for multi-classification (also called Rk statistic) evaluated on the test set will be the metric used to rank the submissions.
Starting from these definitions:
True positive (TP) – The number of correctly identified samples. The number of samples measured in presence of one of the 10 substances of interest.
True negative (TN) – The number of correctly identified negative samples, i.e., samples measured in wastewater.
False positive (FP) – The number of wrongly identified samples, i.e., a commonly called a “false alarm”. The number of samples classified as one of the 10 substances of interest but measured in wastewater.
False negative (FN) – The number of wrongly identified negative samples. The number of sample classified as wastewater but measured in presence of some of the 10 substances of interest.
The MCC is:
